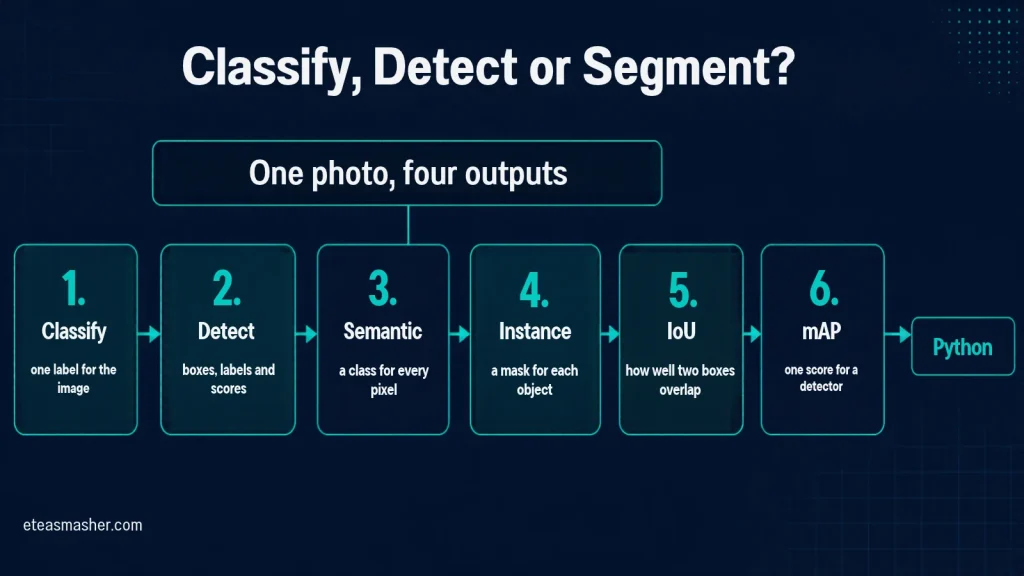
Quick answer: Image classification gives one label for a whole image (“this is a bus”). Object detection finds each object and returns a box, a label and a confidence score for it. Segmentation labels individual pixels: semantic segmentation gives every pixel a class, and instance segmentation also separates each object into its own mask. Each step gives more detail, but costs more to label and to compute.
Most guides explain image classification vs object detection vs segmentation with drawings of cats and dogs. This one runs four real pretrained models (Ultralytics YOLO26) on the same street photo and prints exactly what each one returns. Then we score detections the way benchmarks do, computing IoU and average precision by hand from real predictions and labels. Every output below comes from running the code.
Table of Contents
Image classification vs object detection vs segmentation at a glance
Image classification answers “what is in this image?” with one label (or a ranked list of labels) for the whole image.
Object detection answers “what objects are here, and where?” with a box, a class label and a confidence score for each object.
Image segmentation answers “which pixels belong to what?” with a mask: a class for every pixel (semantic), a separate mask for every object (instance), or both (panoptic).
Task
Output for one image
Typical models
Main metrics
Labelling cost
Image classification
One label, or a score for every class (a vector of 1,000 scores for ImageNet models)
ResNet, ViT, YOLO26-cls
Accuracy, top-1 and top-5 accuracy
Lowest: about 1 second per class per image
Object detection
A list of boxes, each with x1, y1, x2, y2, a class label and a confidence score
YOLO family (YOLO26), Faster R-CNN, DETR and RF-DETR
Precision, recall, mAP at IoU thresholds (mAP50, mAP50-95)
Medium: about 7 to 35 seconds per box
Semantic segmentation
A class map the size of the image: one class id per pixel
U-Net, DeepLabV3, YOLO26-sem
Mean IoU (mIoU), Dice, pixel accuracy
Highest: about 4 minutes per image on PASCAL VOC, over 1.5 hours per image on Cityscapes
Instance segmentation
One binary mask per object, plus a box, label and score
Mask R-CNN, YOLO26-seg, SAM (with prompts)
Mask AP (mAP computed with mask IoU)
High: a polygon or mask for every object
The labelling times come from research papers. On PASCAL VOC, image-level labels for 20 classes take about 20 seconds per image and full per-pixel labels an estimated 239.7 seconds (Bearman et al., 2016). Drawing one high-quality box was reported to take about 35 seconds on ImageNet, and “extreme clicking” cut it to about 7 seconds per box (measured on PASCAL VOC) (Papadopoulos et al., 2017). For Cityscapes street scenes, “annotation and quality control required more than 1.5 h on average for a single image” (Cordts et al., 2016).
What is image classification?
Image classification is the simplest computer vision task. The model looks at the whole image and returns a probability for each class it knows, and you keep the top answer (top-1) or the five best (top-5).
It is a supervised learning problem: you train the model on images that already have the right label. If that idea is new, our guide to supervised vs unsupervised learning explains it with a worked example.
It works well when one answer per image is enough: “is this product damaged?” or “which plant disease is this?”. It does not tell you where the object is, or how many there are.
What is object detection?
Object detection finds every object of the classes it knows and draws a rectangle (a bounding box) around each one. Each box comes with a class label and a confidence score between 0 and 1.
Because the output is a list, detection can count and locate things, which makes it the usual choice for tasks such as people counting, vehicle tracking and shelf monitoring. Boxes are cheap to label and fast to predict, but rough: a box around a person standing in front of a bus also contains part of the bus.
What is image segmentation?
Segmentation works at the pixel level: instead of a box, it says exactly which pixels belong to what. There are three kinds.
Semantic vs instance segmentation
Semantic segmentation gives every pixel in the image a class: road, building, person, sky. It does not separate objects: if four people stand together, all their pixels are simply “person”. The Ultralytics docs put it as assigning “a class label to every pixel in an image”.
Instance segmentation gives each object its own mask. Four people become four separate masks, each with its own label and score. Background such as road or sky is usually ignored. A simple test: if you need to count or track individual objects, you need instance segmentation; if you only need to know how much of the image is road, tumour or water, semantic segmentation is enough.
Panoptic segmentation
Panoptic segmentation combines the two. Every pixel gets a class, and pixels of countable objects (“things”, such as people and cars) also get an object id, while background regions (“stuff”, such as road and sky) do not. The task and its metric, panoptic quality (PQ), were introduced in the Panoptic Segmentation paper by Kirillov and colleagues. It suits uses such as driving and robotics, where you need both the full scene and the separate objects.
One photo, four tasks: the output formats in Python
Now we will run all four tasks on one photo. We use Ultralytics YOLO26, released in January 2026 according to the Ultralytics YOLO26 page. One package covers all four tasks with the same API, and the smallest (“nano”) models run fine on a CPU.
You need a recent version of Python 3. One command installs everything (it pulls in PyTorch, which is a large download):
pip install ultralytics
The model weights download automatically on first use. The test photo, a Madrid street with a bus and several people, ships inside the ultralytics package. We ran this with ultralytics 8.4.202, PyTorch 2.15.0, NumPy 2.5.3 and Python 3.13 on a CPU.
# step1_three_tasks.py
# One photo, four computer vision tasks, four different output formats.
import numpy as np
from ultralytics import YOLO
from ultralytics.utils import ASSETS

img = ASSETS / "bus.jpg"   # sample street photo that ships with the ultralytics package

# 1) Image classification: one label for the whole image
cls = YOLO("yolo26n-cls.pt")(img, verbose=False)[0]
print("CLASSIFICATION output:", tuple(cls.probs.data.shape), "class scores")
for i in cls.probs.top5:
    print(f"  {cls.names[i]:<14} {cls.probs.data[i]:.3f}")

# 2) Object detection: a box, a label and a score for each object
det = YOLO("yolo26n.pt")(img, verbose=False)[0]
print("\nDETECTION output:", tuple(det.boxes.data.shape), "rows of (x1, y1, x2, y2, score, class)")
for x1, y1, x2, y2, score, c in det.boxes.data.tolist():
    print(f"  {det.names[int(c)]:<7} {score:.2f}  box=({x1:.0f}, {y1:.0f}, {x2:.0f}, {y2:.0f})")

# 3) Instance segmentation: one pixel mask per object
seg = YOLO("yolo26n-seg.pt")(img, verbose=False, retina_masks=True)[0]
masks = seg.masks.data.cpu().numpy().astype(bool)      # shape (N, H, W)
print("\nINSTANCE SEGMENTATION output:", masks.shape, "one mask per object")
for m, c, score in zip(masks, seg.boxes.cls.tolist(), seg.boxes.conf.tolist()):
    print(f"  {seg.names[int(c)]:<7} {score:.2f}  pixels={m.sum():,}")

# Turn the masks into one instance map: every object gets its own id (1, 2, 3 ...)
instance_map = np.zeros(masks.shape[1:], dtype=np.int32)
for k, m in enumerate(masks, start=1):
    instance_map[m & (instance_map == 0)] = k
print("  instance ids in map:", np.unique(instance_map)[1:].tolist())

# 4) Semantic segmentation: one class id for every pixel, no object ids
sem_model = YOLO("yolo26n-sem.pt")              # trained on Cityscapes street scenes
sem = sem_model(img, verbose=False, imgsz=640)[0]  # same input size as the other models
class_map = sem.semantic_mask.data.cpu().numpy()   # shape (H, W)
print("\nSEMANTIC SEGMENTATION output:", class_map.shape, "one class id per pixel")
ids, counts = np.unique(class_map, return_counts=True)
for i, n in sorted(zip(ids, counts), key=lambda t: -t[1])[:6]:
    print(f"  {sem.names[int(i)]:<10} {n / class_map.size:5.1%} of pixels")

# The same model at its default input size (1024) reads the bus differently
big = sem_model(img, verbose=False)[0].semantic_mask.data.cpu().numpy()
ids, counts = np.unique(big, return_counts=True)
top = sem.names[int(ids[counts.argmax()])]
print(f"  at default size 1024, largest class: {top} ({counts.max() / big.size:.1%})")

np.savez_compressed("outputs_step1.npz", instance_map=instance_map, class_map=class_map,
                    boxes=det.boxes.data.cpu().numpy())
CLASSIFICATION output: (1000,) class scores
  minibus        0.516
  police_van     0.369
  trolleybus     0.096
  minivan        0.006
  ambulance      0.003

DETECTION output: (5, 6) rows of (x1, y1, x2, y2, score, class)
  bus     0.88  box=(0, 230, 803, 751)
  person  0.87  box=(49, 398, 240, 902)
  person  0.86  box=(223, 405, 345, 861)
  person  0.85  box=(670, 394, 810, 879)
  person  0.66  box=(0, 553, 60, 871)

INSTANCE SEGMENTATION output: (5, 1080, 810) one mask per object
  person  0.88  pixels=49,302
  person  0.86  pixels=21,311
  bus     0.86  pixels=255,375
  person  0.81  pixels=33,411
  person  0.65  pixels=11,100
  instance ids in map: [1, 2, 3, 4, 5]

SEMANTIC SEGMENTATION output: (1080, 810) one class id per pixel
  bus        28.2% of pixels
  road       27.4% of pixels
  building   19.2% of pixels
  person     16.0% of pixels
  vegetation  4.7% of pixels
  sidewalk    2.7% of pixels
  at default size 1024, largest class: train (30.9%)
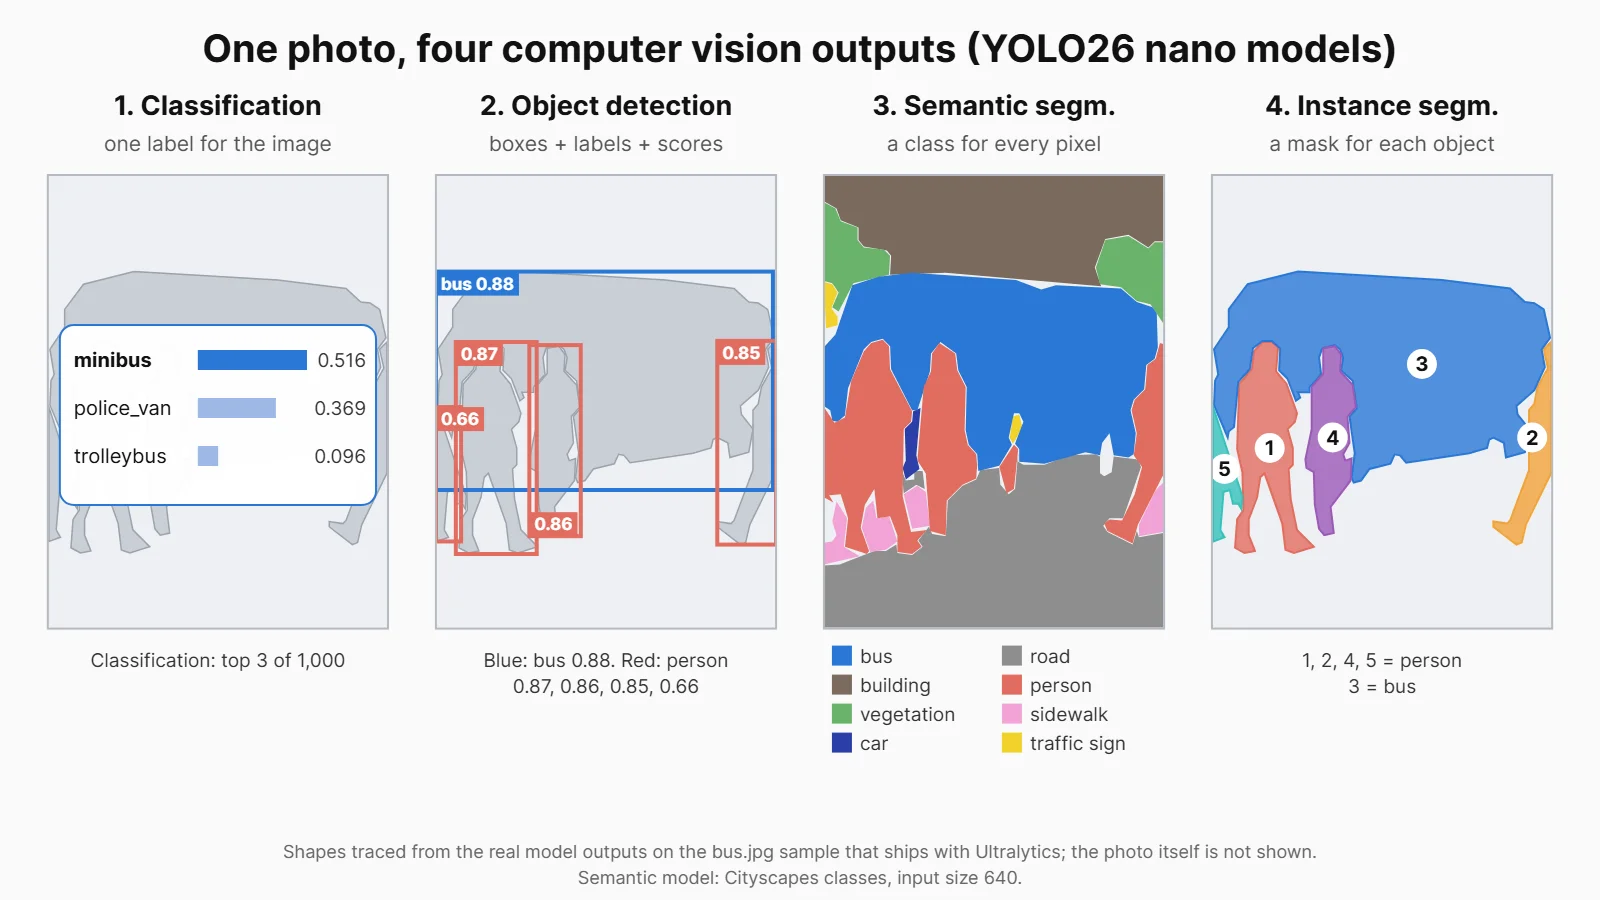
One photo, four computer vision tasks: real outputs from YOLO26 nano models, drawn as shapes. A label, boxes, a class for every pixel, and a mask per object.
The figure traces the real model outputs as shapes, without the photo itself. The shapes are the real difference between the tasks:
Classification returns 1,000 numbers, one per ImageNet class. The top answer, “minibus” at 0.516, is correct, but it ignores the four people, and the runner-up “police_van” at 0.369 shows the model is not very sure.
Detection returns a table with 5 rows and 6 columns: one row per object with the box corners, score and class. Now we know there is one bus and four people, and where. The bus box (0, 230, 803, 751) also covers most of the people standing in front of it.
Instance segmentation returns 5 masks, each the full size of the photo (1080 pixels tall by 810 wide). The bus mask (255,375 pixels) leaves out the people in front of it, which a box cannot do.
Semantic segmentation returns one map of class ids at the same size. It covers road, buildings and trees too, but all the people share one class, so you cannot count them from this map.
Two honest notes. First, the models were trained on different data. The classifier knows the 1,000 ImageNet classes, the detector and instance model know the 80 COCO classes, and the semantic model knows the 19 evaluation classes of Cityscapes, which was recorded from a car driving through the streets of 50 cities. That is probably why the semantic model calls the tiled pavement where the people stand “road”.
Second, at the model’s default input size of 1024 pixels, the same semantic model labelled most of the bus as “train” (30.9% of pixels). At 640 pixels, the size the other three models use, it said “bus”. Input size can change the answer, especially on photos unlike the training data, so always test models on images from your own use case.
Object detection vs segmentation: which one do you need?
Start with the cheapest output that answers your question, because labelling cost rises sharply from labels to boxes to masks.
Choose classification when one answer per image is enough: sorting photos, flagging bad products, triaging medical scans.
Choose object detection when you need to count, locate or track objects and a rough rectangle is fine: counting people, reading licence plates, finding items on shelves.
Choose instance segmentation when the exact shape or area of each object matters: measuring a wound or a crack, robot grasping, removing a background around one person.
Choose semantic segmentation when you care about regions, not separate objects: road and lane areas, land cover in satellite images, tumour areas in scans.
Choose panoptic segmentation when you need both the full scene and the individual objects, as in driving and robotics.
A shortcut: promptable models such as Segment Anything (SAM) can take a box as a prompt and return a mask for the object inside it, which can save hand-drawing masks.
How each task is measured: accuracy, mAP vs IoU, mIoU and Dice
Classification is scored with accuracy: the share of images where the right class is the top answer (top-1) or among the top five (top-5). Detection and segmentation also need to check the location, and the building block for that is IoU.
IoU: how much two shapes overlap
Intersection over Union (IoU) divides the area where the predicted box and the true box overlap by the area they cover together. It is 1.0 for a perfect match and 0 when they do not touch. A detection usually counts as correct only if its IoU with a labelled box is at least 0.5.
mAP vs IoU: they work at different levels. IoU scores one prediction against one label. Average precision (AP) scores a whole ranked list of predictions for one class, and mean average precision (mAP) is the average of AP over all classes. IoU is the rule inside mAP that decides whether each prediction is a hit.
A worked example with real predictions and labels
The code below computes IoU by hand. Then it runs the detector on the 4 validation images of COCO8, a tiny 8-image sample of the COCO dataset that Ultralytics downloads automatically (under 1 MB), and computes precision, recall and AP for the “person” class.
# step2_iou_ap.py
# IoU and average precision (AP) by hand, on real predictions and real labels.
from pathlib import Path
import numpy as np
from ultralytics import YOLO
from ultralytics.data.utils import check_det_dataset

def iou(a, b):
    """Intersection over Union of two boxes given as (x1, y1, x2, y2)."""
    ix1, iy1 = max(a[0], b[0]), max(a[1], b[1])
    ix2, iy2 = min(a[2], b[2]), min(a[3], b[3])
    inter = max(0, ix2 - ix1) * max(0, iy2 - iy1)
    area_a = (a[2] - a[0]) * (a[3] - a[1])
    area_b = (b[2] - b[0]) * (b[3] - b[1])
    return inter / (area_a + area_b - inter)

# Three toy boxes to build intuition: 100 x 100 squares shifted to the right
print("IoU, same box:          ", round(iou((0, 0, 100, 100), (0, 0, 100, 100)), 3))
print("IoU, shifted 20 pixels: ", round(iou((0, 0, 100, 100), (20, 0, 120, 100)), 3))
print("IoU, shifted 50 pixels: ", round(iou((0, 0, 100, 100), (50, 0, 150, 100)), 3))

# Real data: the 4 validation images of COCO8 (a tiny 8-image sample of COCO)
data = check_det_dataset("coco8.yaml")          # downloads it (under 1 MB) if missing
val_dir = Path(data["val"])
model = YOLO("yolo26n.pt")

PERSON = 0
gts, preds = {}, []                              # ground truth per image, all predictions
for img_path in sorted(val_dir.glob("*.jpg")):
    r = model(img_path, verbose=False)[0]        # default confidence threshold 0.25
    h, w = r.orig_shape
    rows = np.loadtxt(val_dir.parent.parent / "labels/val" / f"{img_path.stem}.txt", ndmin=2)
    # YOLO label format is (class, x_center, y_center, width, height), scaled 0 to 1
    gts[img_path.stem] = [((xc - bw / 2) * w, (yc - bh / 2) * h, (xc + bw / 2) * w, (yc + bh / 2) * h)
                          for c, xc, yc, bw, bh in rows if c == PERSON]
    for *box, score, c in r.boxes.data.tolist():
        if int(c) == PERSON:
            preds.append((score, img_path.stem, box))

n_gt = sum(len(v) for v in gts.values())
preds.sort(key=lambda p: -p[0])                  # highest confidence first
print(f"\nperson: {n_gt} labelled, {len(preds)} predicted")

def evaluate(threshold, show=False):
    """Greedy matching: each label can be matched by at most one prediction."""
    used = {k: set() for k in gts}
    tp, fp, rows = 0, 0, []
    for score, stem, box in preds:
        ious = [iou(box, g) for g in gts[stem]]
        best = int(np.argmax(ious)) if ious else -1
        best_iou = ious[best] if ious else 0.0
        hit = best_iou >= threshold and best not in used[stem]
        if hit:
            used[stem].add(best)
        tp, fp = tp + hit, fp + (not hit)
        rows.append((tp / (tp + fp), tp / n_gt))
        if show:
            print(f"  {score:.2f}  {stem}  IoU={best_iou:.2f}  {'TP' if hit else 'FP'}"
                  f"  precision={tp / (tp + fp):.2f}  recall={tp / n_gt:.2f}")
    # AP = area under the precision-recall curve (all-point interpolation)
    p = np.array([r[0] for r in rows]); rc = np.array([r[1] for r in rows])
    p = np.maximum.accumulate(p[::-1])[::-1]      # make precision never go up as recall grows
    ap = np.sum(np.diff(np.concatenate([[0], rc])) * p)
    return ap, rc[-1], p

print("\nRanked predictions at IoU threshold 0.5:")
ap50, rec50, _ = evaluate(0.5, show=True)
ap75, rec75, _ = evaluate(0.75)
print(f"\nAP@0.5  = {ap50:.3f}  (final recall {rec50:.2f})")
print(f"AP@0.75 = {ap75:.3f}  (final recall {rec75:.2f})")
aps = [evaluate(t)[0] for t in np.arange(0.5, 0.96, 0.05)]
print(f"AP@[0.5:0.95] = {np.mean(aps):.3f}  (mean of 10 thresholds)")
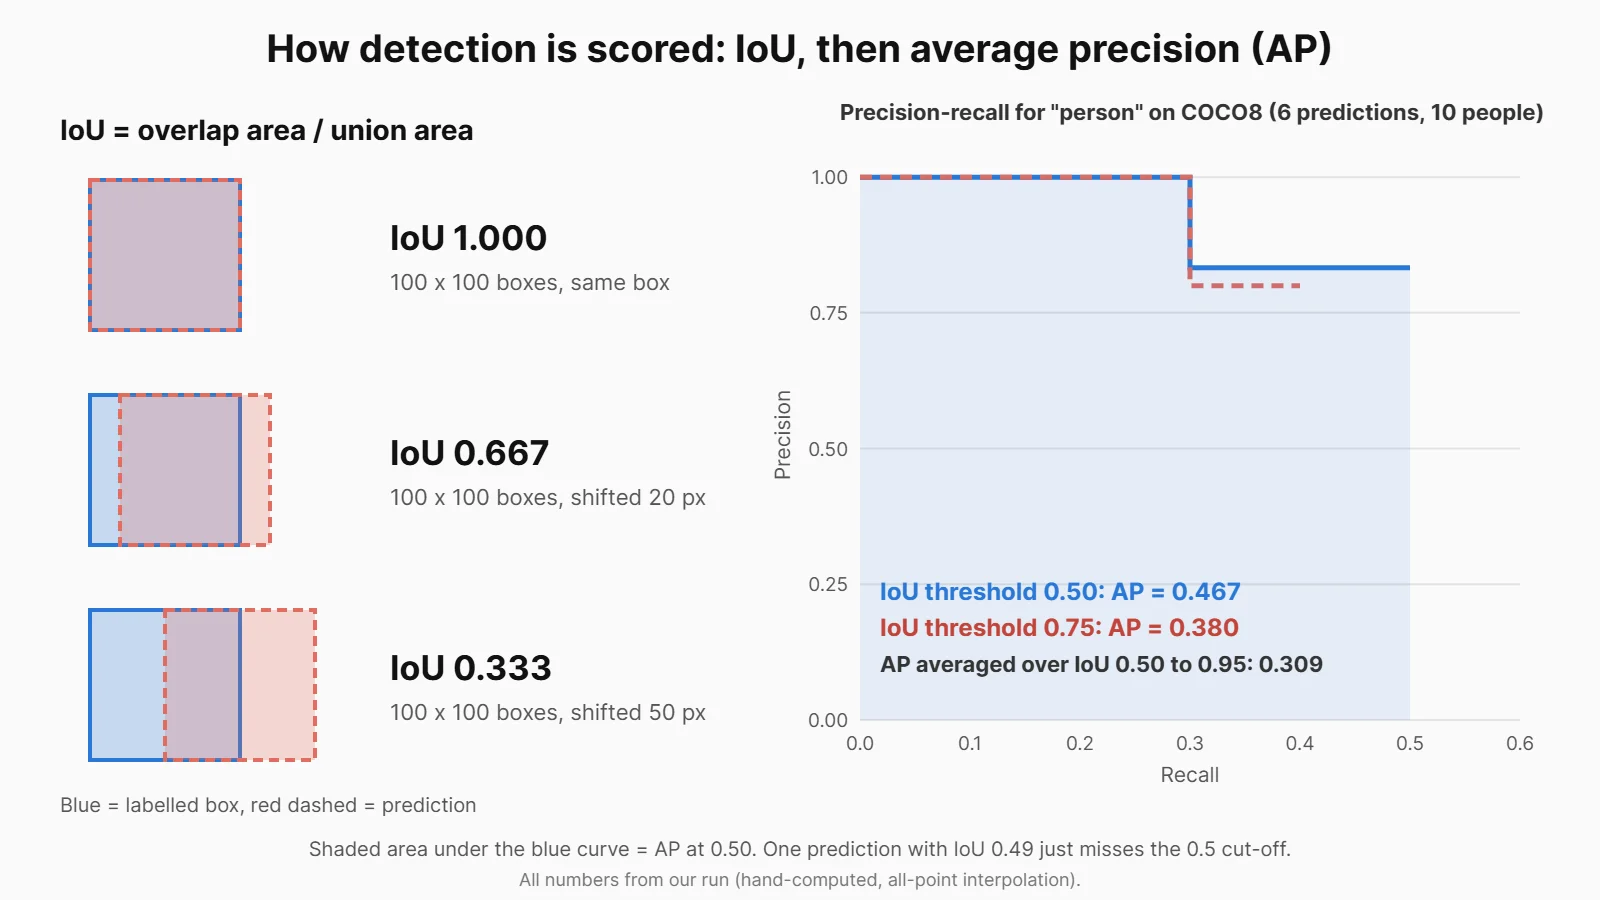
How detection is scored: IoU decides whether a prediction is a hit, and AP summarises the ranked predictions. All numbers from our run on COCO8.
How to read it:
IoU is strict. Boxes that overlap by half their width get an IoU of 0.333, not 0.5.
One prediction missed by less than 0.01. The fourth prediction found a small person in the background, but its box was a few pixels too wide. Its IoU of 0.49 is just under 0.5, so it counts as a false positive (FP).
Precision and recall move as we go down the list. Precision is the share of predictions so far that were correct; recall is the share of the 10 labelled people found so far. The model found only 5 of 10, missing several small background figures.
A stricter IoU threshold lowers AP. At 0.5 the AP is 0.467. At 0.75 the last prediction (IoU 0.66) also becomes a miss, and AP falls to 0.380. Averaged over the 10 thresholds from 0.50 to 0.95, it is 0.309.
That last number is how COCO reports detection. The COCO evaluation page states that AP is “averaged over multiple Intersection over Union (IoU) values”, using 10 thresholds from 0.50 to 0.95, and that it makes “no distinction between AP and mAP”. In tools such as Ultralytics this appears as mAP50-95, while mAP50 uses the single, more lenient 0.5 threshold. COCO samples the curve at 101 recall points, so its numbers differ slightly from our simple version.
The same rules apply to instance segmentation. COCO says the box and mask metrics are “identical in all respects except for the IoU computation”, which is done on masks instead of boxes. That is what mask AP means.
For semantic segmentation there are no objects to match, so you compute IoU per class over all pixels and average over classes: mean IoU (mIoU). The Dice coefficient, common in medical imaging, is a close relative: twice the overlap divided by the sum of the two areas. For the same two masks it is never lower than IoU.
The standard metric for every task in one run
Ultralytics computes all of these for you. The script below validates each model on a tiny sample dataset with 4 to 12 validation images, so the numbers show what each metric looks like; they are not benchmark scores.
# step3_validate.py
# The standard metric for each task, computed by Ultralytics on tiny sample datasets.
# These datasets have only a handful of validation images, so the numbers show
# what each metric looks like; they are NOT benchmark scores.
from ultralytics import YOLO

kw = dict(verbose=False, plots=False)

cls = YOLO("yolo26n-cls.pt").val(data="imagenet10", imgsz=224, **kw)
print(f"classification  top-1 accuracy={cls.top1:.3f}  top-5 accuracy={cls.top5:.3f}")

det = YOLO("yolo26n.pt").val(data="coco8.yaml", **kw)
print(f"detection       box mAP50={det.box.map50:.3f}  box mAP50-95={det.box.map:.3f}")
person = list(det.box.ap_class_index).index(0)
print(f"                person AP50={det.box.ap50[person]:.3f}  (at confidence 0.001, not 0.25)")

seg = YOLO("yolo26n-seg.pt").val(data="coco8-seg.yaml", **kw)
print(f"instance seg.   box mAP50-95={seg.box.map:.3f}  mask mAP50={seg.seg.map50:.3f}  mask mAP50-95={seg.seg.map:.3f}")

sem = YOLO("yolo26n-sem.pt").val(data="cityscapes8.yaml", **kw)
m = sem.results_dict
print(f"semantic seg.   mIoU={m['metrics/mIoU']:.3f}  pixel accuracy={m['metrics/pixel_acc']:.3f}")

# Mask IoU and Dice by hand: how well do the instance model's bus mask and the
# semantic model's "bus" pixels from step 1 agree? (agreement, not accuracy)
import numpy as np
d = np.load("outputs_step1.npz")
a = d["instance_map"] == 3                      # instance 3 is the bus
b = d["class_map"] == 15                        # class 15 is "bus" in Cityscapes
inter, union = (a & b).sum(), (a | b).sum()
print(f"bus masks       IoU={inter / union:.3f}  Dice={2 * inter / (a.sum() + b.sum()):.3f}")
(Ultralytics also prints progress logs, left out here.) Four things stand out:
Tiny samples give strange numbers. The classification sample is 12 small 160-pixel thumbnails, some duplicated, and the model got 3 right (0.250). On the full ImageNet validation set, the Ultralytics classification docs list 71.4% top-1 accuracy for this same model.
Validation settings change AP. Our hand-made person AP50 was 0.467; Ultralytics reports 0.848 on the same images. Validation keeps predictions down to a confidence of 0.001 instead of 0.25, which finds more small people. It also resizes and pads images differently from prediction (rect=True by default), which changes the predictions again; the Ultralytics validation docs note that validation metrics can differ from predict(). Run with conf=0.25 and it reports 0.495, close to our 0.467. Check the settings before comparing AP numbers.
Masks score lower than boxes. Mask mAP50-95 (0.534) is below box mAP50-95 (0.629) on the same images, because matching an exact outline is harder.
Pixel accuracy flatters. The semantic model got 96.4% of pixels right but only 0.610 mIoU, because large classes like road dominate the pixel count while mIoU gives every class an equal vote. For our two bus masks, Dice (0.959) is above IoU (0.922), as the formula predicts.
Well-known models for each task in 2026
These are the families you will meet most often. All are publicly available (some need you to accept a licence first) and can be fine-tuned on your own labelled images.
YOLO models are built for real-time speed; DETR treats detection as “direct set prediction” and removes the need for non-maximum suppression; RF-DETR is a newer real-time transformer from Roboflow
SAM (2023) was trained on over 1 billion masks; SAM 3 (November 2025) accepts short text prompts and returns a mask for every matching object; SAM 3.1 followed in March 2026
One licensing note before you build a product. Ultralytics code and models are released under AGPL-3.0, with a paid enterprise license for closed-source commercial use. The rfdetr package and its Nano to Large detection models (plus all segmentation sizes) are Apache 2.0, while the XL, 2XL and tiny Atto, Femto and Pico detection models use Roboflow’s PML 1.0 licence. Check the license of any model before you ship it.
To practise, our list of real-world AI projects includes projects that work with images, and the machine learning roadmap shows the wider machine learning path that computer vision builds on.
Common mistakes
Choosing segmentation by default. Masks cost far more to label than boxes or image labels. Start with the cheapest output that answers your question.
Using classification to count. Our classifier said “minibus” and ignored four people. Use detection when number or position matters.
Using semantic masks to separate objects. Semantic segmentation merged all the people into one region. Use instance segmentation to count or track individuals.
Comparing mAP numbers with different settings. mAP50 and mAP50-95 differ, and the confidence threshold and image preprocessing change the result (our 0.467 vs 0.848).
Trusting pixel accuracy alone. Large background classes make pixel accuracy look good. Report mIoU or Dice as well.
Ignoring the training data. A model only knows the classes and kinds of images it was trained on; our Cityscapes model called a bus a “train” at one input size.
Frequently asked questions
What is the difference between image classification, object detection and segmentation?
Image classification gives one label for the whole image. Object detection finds each object and returns a box, label and confidence score for it. Segmentation labels pixels: semantic segmentation gives every pixel a class, and instance segmentation gives each object its own mask.
What is the difference between semantic and instance segmentation?
Semantic segmentation assigns a class to every pixel but does not separate objects, so four people become one “person” region. Instance segmentation gives each object its own mask, so you can count and track them. Panoptic segmentation combines both, labelling every pixel and separating countable objects.
Is object detection better than segmentation?
Neither is better in general; they answer different questions. Detection is cheaper to label and faster to run, and it is enough for counting and locating objects. Segmentation is worth its extra cost when you need exact shapes or areas, such as measuring damage or cutting an object out of an image.
What is the difference between mAP and IoU?
IoU measures how well one predicted box or mask overlaps one labelled object, from 0 to 1. mAP summarises a model’s whole ranked list of predictions across all classes, and uses an IoU threshold to decide which predictions count as correct. mAP50 uses a threshold of 0.5, while mAP50-95 averages ten thresholds from 0.5 to 0.95.
Key points
Classification returns one label per image, detection returns boxes with labels and scores, and segmentation returns pixel masks.
On one street photo, the classifier said “minibus” (0.516), the detector found 1 bus and 4 people, the instance model gave 5 masks, and the semantic model labelled every pixel but merged the people.
Semantic segmentation labels regions, instance segmentation separates objects, and panoptic segmentation does both.
IoU scores one prediction; mAP scores a ranked list of predictions using IoU thresholds. In our worked example, person AP fell from 0.467 at IoU 0.5 to 0.380 at IoU 0.75.
Labelling cost rises from seconds per image for labels to 7 to 35 seconds per box and minutes or hours per image for masks, so pick the simplest task that answers your question.