
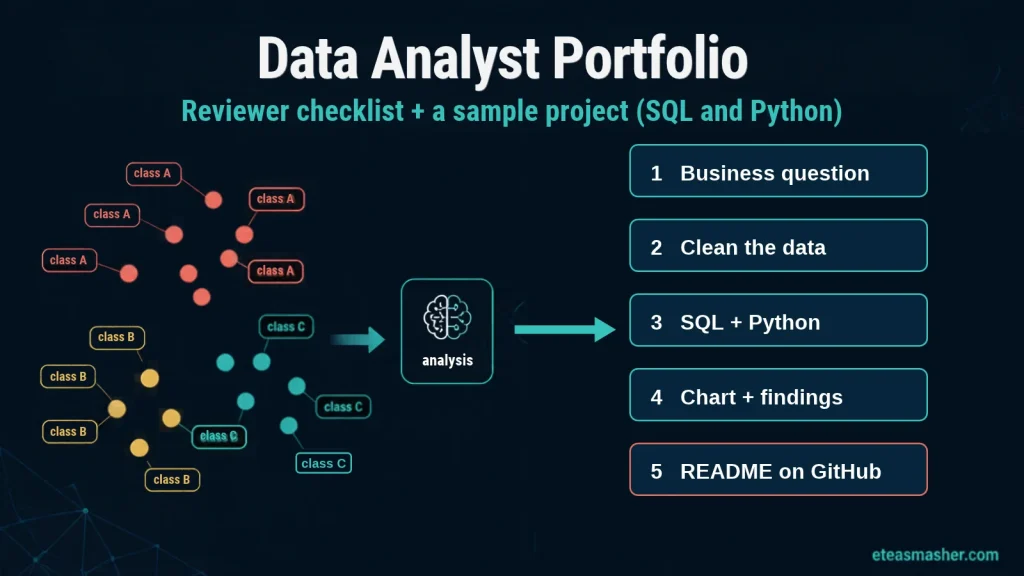
Quick answer: A data analyst portfolio that gets interviews has three or four small projects, and each one starts with a business question, shows how you cleaned the data, uses SQL and Python or a BI tool, and ends with clear findings and a recommendation. Each project needs a short README, because reviewers want to see your reasoning, not only your code. Choose fresh data over overused datasets like Titanic, and make everything easy to scan on GitHub, Tableau Public or Kaggle.
Many guides on building a data analyst portfolio give a list of project ideas. This one turns published advice from career platforms, course providers and an analyst who has hired for these roles into one sourced checklist of what reviewers look for. Then it builds one complete sample project, from business question to SQL window function to chart to README, and every output shown comes from running the code.
Table of Contents
What a data analyst portfolio is, and why it matters
A data analyst portfolio is a small public collection of projects that proves you can turn raw data into answers. Your resume says you know SQL; your portfolio shows a query you wrote, the question it answered and what you recommended.
It matters most when you are trying to get a data analyst job with no experience. Google’s Data Analytics Capstone course says “many employers ask for a link to a portfolio” and that “hiring managers often want proof that you can apply concepts in a meaningful way.” Coursera’s portfolio guide makes the same point: a portfolio validates your skills “in a way that’s hard to do with a resume alone.”
If you are still deciding whether data analysis is the right role for you, our overview of career paths in big data and data science compares it with the roles around it.
The data analyst portfolio checklist: what reviewers look for
Different reviewers look for different things. BrainStation’s portfolio guide puts it simply: “A recruiter is looking for specific words and skills,” “a technical lead is looking at the efficiency of your analysis,” and “a manager is looking to see if you understand what your recommendation is based on.” It also says that for junior roles, hiring managers are “looking for potential, coachability, and a solid grasp of the fundamentals,” not perfection.
Brian Graves, who writes the Analytics in Action newsletter, says he has “reviewed portfolios when hiring analysts.” In his post on the three-project portfolio, he lists four things that separate the portfolios that get interviews: clear business context, documented thinking, actionable recommendations and clean, readable SQL. In his view, “The write-up matters more than the code.”
Together, the published advice gives this checklist. Run every project through it before you share it.
| Checklist item | What the reviewer wants to see | Source |
|---|---|---|
| A business question at the top | Why this analysis exists and who it helps | Brian Graves; Dataquest |
| Your reasoning, not only results | Why you chose this metric, this chart, this filter | Brian Graves; BrainStation |
| Visible data cleaning | Missing values, duplicates and data quality problems you found and fixed | Coursera; Interview Query |
| Readable SQL and code | Code another analyst could maintain, with short comments | Brian Graves; Dataquest |
| Clear charts with context | Simple, clear charts with context on why they matter | Interview Query |
| Findings and a recommendation | What the business should do, based on the numbers | Brian Graves; BrainStation |
| What the answer is based on | What the recommendation is based on and which assumptions you checked | BrainStation |
| Fresh data | Not the same dataset every other applicant uses | Dataquest; CareerFoundry |
| A README for each project | Problem, data, process, challenges and insights on one page | Dataquest |
| A few strong projects | Three or four projects, not ten weak ones | Dataquest; Interview Query |
| Easy to scan | Tools named clearly, a clean layout, no hunting for the point | BrainStation; CareerFoundry |
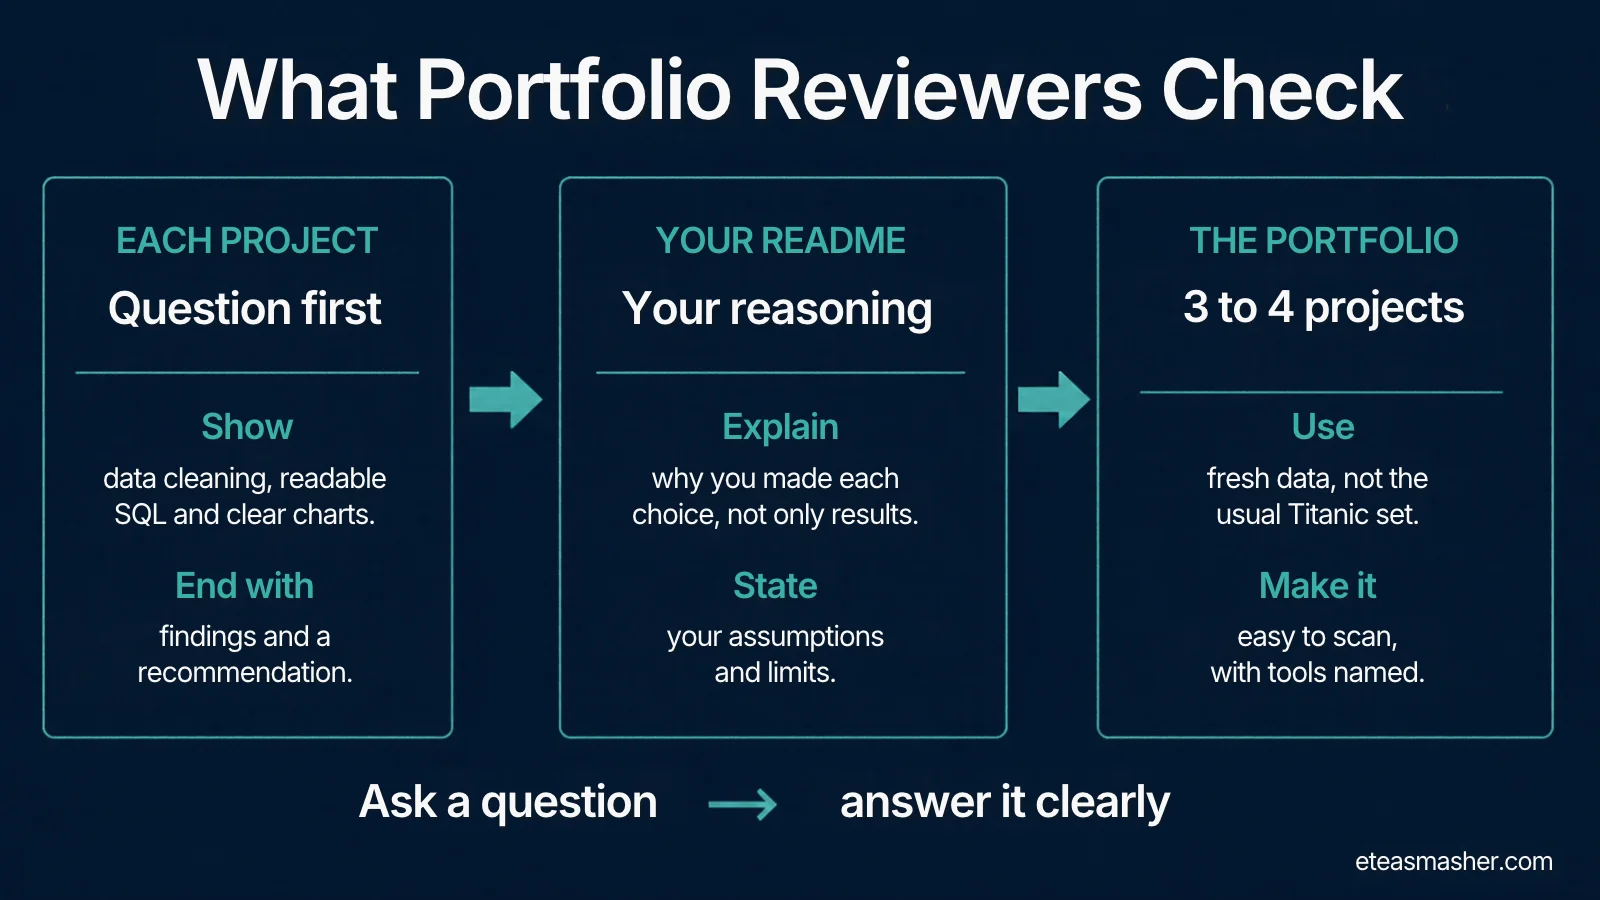
On fresh data, Dataquest’s portfolio guide says to avoid overused datasets such as Titanic, and CareerFoundry’s guide quotes Airbnb data scientist Jason Goodman: “it’s hard to get noticed if you’re using data everyone else has.” On scanning, CareerFoundry warns that “recruiters are going to move fast.”
How many data analyst portfolio projects you need
Three or four good projects is the common advice. Dataquest says a portfolio “should contain 3-4 well-structured projects that demonstrate a variety of skills,” and Interview Query says “showcasing 3 to 4 of your best projects strikes the right balance.” Coursera’s version is shorter: “less is more.”
Aim for variety across the set. Our data analyst roadmap suggests at least one project with SQL, one with Python and one with a dashboard. Here are data analyst projects for beginners that cover those skills without needing paid data:
| Project idea | Main skills shown | Business question example |
|---|---|---|
| Seasonal demand analysis (the sample below) | SQL window functions, pandas, a chart | When should a business schedule outdoor events? |
| Sales or KPI dashboard | Spreadsheets or Power BI or Tableau, KPI design | Which region is missing its monthly target, and since when? |
| Customer churn analysis | SQL joins, cohort analysis, Python | Which customers stop buying after their first order? |
| Public service data from your city | Data cleaning, maps, written insight | Which areas wait longest for a service request to be closed? |
| Before and after comparison | Simple statistics, clear communication | Did a price change or policy change shift behaviour? |
A course capstone counts as a project. Google’s Data Analytics Certificate ends with an optional case study “that you can share with potential employers,” and IBM’s Data Analyst Professional Certificate includes a capstone project (course 9 of 11) “designed to showcase your newly learned data analyst skills.” Other learners finish the same capstones, though, so add your own question or a second dataset to make yours different.
If you want a dashboard-heavy portfolio, our certified BI analyst roadmap covers Tableau and Power BI in more depth.
Where to host your portfolio
Coursera’s guide makes a useful point here: “The contents of your portfolio are more important than where you choose to host it.” Pick one main home and link everything from it.
- GitHub suits SQL and Python projects. A profile README appears on your profile when you create a public repository with the same name as your username and add a README.md file with some content to its root. You can also pin up to six repositories and gists, so put your best projects there.
- Tableau Public suits dashboards. Tableau describes it as “a free platform to explore, create and publicly share data visualizations online.” Everything you publish there is public, so only use public data.
- Kaggle Notebooks suit Python analysis. Kaggle describes them as a cloud environment “that enables reproducible and collaborative analysis.”
Sample data analyst portfolio project, built step by step
Here is one complete, small project built to pass the checklist above. Use it as a model for structure, not as a project to copy.
Business question: An outdoor events company in Seattle wants to know which months give the best chance of a dry day, and how much that changes from year to year.
Data: Daily weather for Seattle from 2012 to 2015 (1,461 days), shipped inside the vega_datasets Python package, so it works offline. That package is now archived (its datasets moved into Altair as altair.datasets) and it bundles an older copy of the data, which, as you will see, is useful for practising data cleaning. The vega-datasets catalog lists the source as NOAA’s National Climatic Data Center and the licence as a U.S. Government dataset (public domain). The catalog also says the data “is intended for instructional purposes,” and the project README calls its licence notes “a starting point rather than definitive guidance,” so cite the original source in your own README.
Tools and versions used: Python 3.13, pandas 3.0.5, matplotlib 3.11.2, vega_datasets 0.9.0 and SQLite 3.53.1 (through Python’s built-in sqlite3 module). Install the packages with:
pip install pandas matplotlib vega_datasetsStep 1: Clean the data and check if you can trust it
Cleaning is more than dropping empty rows. Check for missing values, duplicates and gaps in the calendar, and then check whether each column means what you think it means.
# step1_clean.py
import sqlite3
import pandas as pd
from vega_datasets import local_data   # ships the CSV inside the package, works offline

df = local_data.seattle_weather()
print(df.shape)
print(df.head(3))

# 1. Basic checks: missing values, duplicate dates, gaps in the calendar
print("missing values:", int(df.isna().sum().sum()))
print("duplicate dates:", int(df.duplicated("date").sum()))
full_range = pd.date_range(df["date"].min(), df["date"].max(), freq="D")
print("missing days:", len(full_range.difference(df["date"])))

# 2. Can we trust the 'weather' label? Compare it with measured precipitation
df["year"] = df["date"].dt.year
df["wet"] = df["precipitation"] > 0
wet_days = df[df["wet"]]
print(pd.crosstab(wet_days["year"], wet_days["weather"]))

# 3. Decision: ignore the label, define a dry day from the measurement
df["is_dry"] = (~df["wet"]).astype(int)
df["month"] = df["date"].dt.month
clean = df[["date", "year", "month", "precipitation", "temp_max", "is_dry"]].copy()
clean["date"] = clean["date"].dt.strftime("%Y-%m-%d")

# 4. Load the clean table into SQLite for the SQL step
with sqlite3.connect("weather.db") as con:
    clean.to_sql("daily_weather", con, if_exists="replace", index=False)
    print("rows in SQLite:", con.execute("SELECT COUNT(*) FROM daily_weather").fetchone()[0])
(1461, 6)
date precipitation temp_max temp_min wind weather
0 2012-01-01 0.0 12.8 5.0 4.7 drizzle
1 2012-01-02 10.9 10.6 2.8 4.5 rain
2 2012-01-03 0.8 11.7 7.2 2.3 rain
missing values: 0
duplicate dates: 0
missing days: 0
weather drizzle fog rain snow sun
year
2012 0 0 156 21 0
2013 1 66 49 2 34
2014 0 123 2 0 25
2015 0 121 5 0 18
rows in SQLite: 1461The basic checks pass: no missing values, no duplicate dates and no missing days. The crosstab is the interesting part. It only counts days with measured rain, yet in 2014 just 2 of those 150 wet days are labelled “rain.” The other 148 are labelled “fog” or even “sun.” In 2012 the same label works as expected. The catalog says the weather field is “synthesized from multiple fields.” In this older packaged copy the label stops matching measured rain after 2012. The vega-datasets project has since re-encoded the label (CHANGELOG, version 2.0), so a fresh download will not show this problem. That is one more reason to check labels against measurements instead of trusting them.
Counting “rain” labels would have told us 2014 had almost no rain. So we drop the label and define a dry day from the measurement: 0 mm of precipitation. Write decisions like this down, because they change the answer.
Step 2: Answer the question in SQL with window functions
SQLite comes with Python, so you need no database server. The query below uses a CTE to get the share of dry days for each month of each year, then three window functions: RANK() ranks months within each year, and AVG() and MIN() with OVER (PARTITION BY month) compare the same month across years without collapsing the rows.
# step2_sql.py
import sqlite3
import pandas as pd

QUERY = """
WITH monthly AS (                       -- one row per year and month
    SELECT year, month,
           COUNT(*)      AS days,
           SUM(is_dry)   AS dry_days,
           100.0 * SUM(is_dry) / COUNT(*) AS dry_pct
    FROM daily_weather
    GROUP BY year, month
),
ranked AS (                             -- window functions: compare months and years
    SELECT *,
           RANK() OVER (PARTITION BY year ORDER BY dry_pct DESC) AS rank_in_year,
           AVG(dry_pct) OVER (PARTITION BY month)                 AS avg_dry_pct,
           MIN(dry_pct) OVER (PARTITION BY month)                 AS worst_year_pct
    FROM monthly
)
SELECT month,
       ROUND(MAX(avg_dry_pct), 1)    AS avg_dry_pct,
       ROUND(MAX(worst_year_pct), 1) AS worst_year_pct,
       SUM(rank_in_year <= 3)        AS years_in_top3
FROM ranked
GROUP BY month
ORDER BY avg_dry_pct DESC;
"""

with sqlite3.connect("weather.db") as con:
    print("SQLite version:", sqlite3.sqlite_version)
    result = pd.read_sql_query(QUERY, con)

print(result.to_string(index=False))
result.to_csv("monthly_summary_sql.csv", index=False)
SQLite version: 3.53.1
month avg_dry_pct worst_year_pct years_in_top3
7 91.1 77.4 4
8 82.3 71.0 3
5 72.6 61.3 2
9 70.8 53.3 1
6 69.2 53.3 2
10 50.8 38.7 0
4 50.8 43.3 0
1 46.8 29.0 0
3 41.1 29.0 0
11 40.8 33.3 0
2 35.4 32.1 0
12 34.7 12.9 0The years_in_top3 column makes this query useful for a business, because an average can hide one great year and three bad ones. July was one of the three driest months in all four years, a much stronger claim than “July has a high average.” If window functions are new to you, try our SQL window functions practice problems first. SQLite has supported window functions since version 3.25.0, released in 2018.
Step 3: Check the result in pandas and draw the chart
Getting the same answer two ways is a cheap way to catch mistakes. This step rebuilds the numbers in pandas, compares them with SQL and saves the chart.
# step3_analysis_chart.py
import sqlite3
import pandas as pd
import matplotlib
matplotlib.use("Agg")                  # draw to a file, no window needed
import matplotlib.pyplot as plt

with sqlite3.connect("weather.db") as con:
    df = pd.read_sql_query("SELECT * FROM daily_weather", con, parse_dates=["date"])

# Dry-day percentage for every month of every year
monthly = (df.groupby(["year", "month"])
             .agg(dry_pct=("is_dry", "mean"), high_c=("temp_max", "mean"))
             .reset_index())
monthly["dry_pct"] *= 100
table = monthly.pivot(index="month", columns="year", values="dry_pct")

summary = pd.DataFrame({
    "avg_dry_pct": table.mean(axis=1).round(1),
    "worst_year": table.min(axis=1).round(1),
    "best_year": table.max(axis=1).round(1),
    "avg_high_c": monthly.groupby("month")["high_c"].mean().round(1),
})
print(table.round(1).to_string())
print()
print(summary.sort_values("avg_dry_pct", ascending=False).head(5).to_string())

# Check the pandas result against the SQL result from step 2
sql = pd.read_csv("monthly_summary_sql.csv").set_index("month").sort_index()
print("\nmatches SQL:", (summary["avg_dry_pct"] - sql["avg_dry_pct"]).abs().max() < 0.05)

# Chart: average dry-day share per month, with the range across the 4 years
months = ["Jan", "Feb", "Mar", "Apr", "May", "Jun", "Jul", "Aug", "Sep", "Oct", "Nov", "Dec"]
best = summary["avg_dry_pct"].nlargest(2).index           # July and August
colors = ["#2a78d6" if m in best else "#b7c9e2" for m in summary.index]

fig, ax = plt.subplots(figsize=(8, 4.5), dpi=200)
fig.patch.set_facecolor("#fcfcfb")
ax.set_facecolor("#fcfcfb")
ax.bar(months, summary["avg_dry_pct"], color=colors, width=0.62, zorder=2)
ax.vlines(months, summary["worst_year"], summary["best_year"],
          color="#52514e", linewidth=1.5, zorder=3, label="Range across 2012 to 2015")
for m in best:
    ax.annotate(f"{summary.loc[m, 'avg_dry_pct']:.0f}%", (months[m - 1], summary.loc[m, "best_year"]),
                xytext=(0, 5), textcoords="offset points", ha="center",
                fontsize=10, fontweight="bold", color="#0b0b0b")
ax.set_ylim(0, 112)
ax.set_yticks(range(0, 101, 20))
ax.set_ylabel("Dry days (% of days in month)", color="#52514e")
ax.set_title("Seattle: share of dry days by month (bars = 4-year average)",
             loc="left", fontsize=12, color="#0b0b0b")
ax.grid(axis="y", color="#e4e3df", linewidth=0.8, zorder=0)
for side in ["top", "right", "left"]:
    ax.spines[side].set_visible(False)
ax.spines["bottom"].set_color("#b5b4ae")
ax.tick_params(colors="#52514e", length=0)
ax.legend(frameon=False, loc="upper left", fontsize=9, labelcolor="#52514e")
fig.text(0.01, 0.01, "Data: NOAA daily records for Seattle 2012 to 2015, via vega_datasets. Dry day = 0 mm precipitation.",
         fontsize=7.5, color="#7a7974")
fig.tight_layout(rect=(0, 0.03, 1, 1))
fig.savefig("dry_days_by_month.png", facecolor=fig.get_facecolor())
print("saved dry_days_by_month.png")
year 2012 2013 2014 2015
month
1 29.0 45.2 58.1 54.8
2 34.5 35.7 32.1 39.3
3 29.0 51.6 35.5 48.4
4 43.3 46.7 56.7 56.7
5 67.7 61.3 74.2 87.1
6 53.3 66.7 70.0 86.7
7 77.4 100.0 93.5 93.5
8 100.0 71.0 77.4 80.6
9 90.0 53.3 70.0 70.0
10 48.4 61.3 38.7 54.8
11 33.3 50.0 46.7 33.3
12 12.9 54.8 51.6 19.4
avg_dry_pct worst_year best_year avg_high_c
month
7 91.1 77.4 100.0 26.0
8 82.3 71.0 100.0 26.1
5 72.6 61.3 87.1 19.3
9 70.8 53.3 90.0 21.9
6 69.2 53.3 86.7 22.4
matches SQL: True
saved dry_days_by_month.png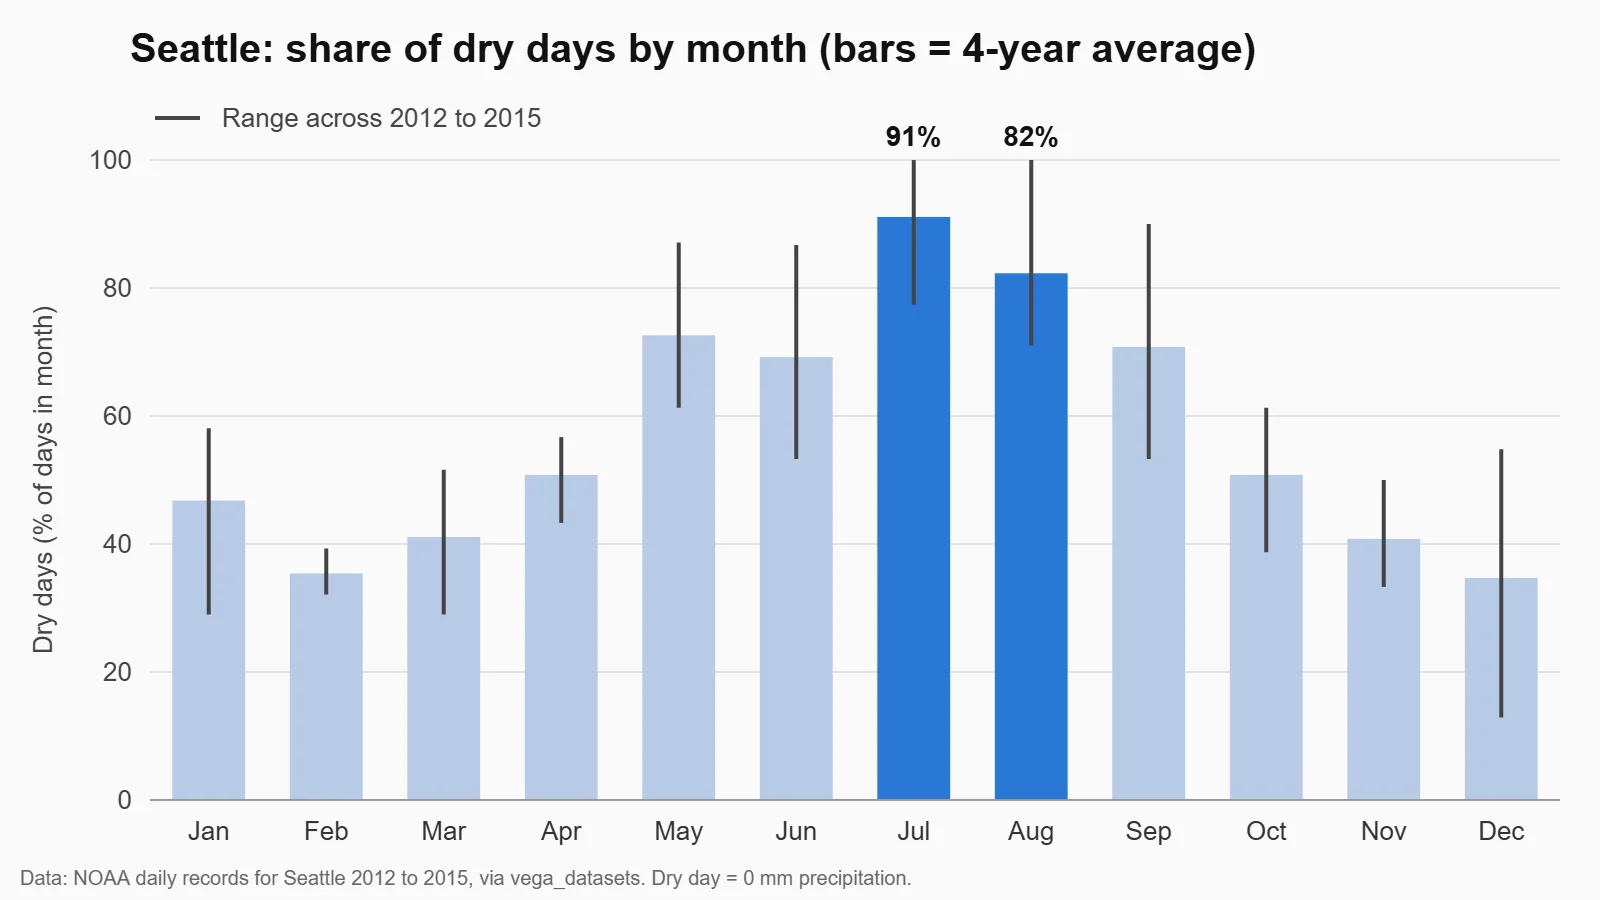
A common trap here: if you round each month’s percentage before averaging, August’s average comes out at exactly 82.25. SQLite rounds that to 82.3 and pandas, which rounds half to even, to 82.2, so the check fails. Both versions above keep full precision and round only at the end, so they agree. That is why the check is worth having, and a short line about it in your README shows a reviewer that you test your own work. The chart keeps one message: the two best months are highlighted, and the lines show the year-to-year range so nobody mistakes an average for a promise.
Step 4: Write the findings the way a README should
This is the part reviewers read first, so keep it short and lead with the answer. Here is the findings section for this project:
## Findings

1. July is the safest month for outdoor events. On average 91.1% of July days
   were dry, July was one of the 3 driest months in all 4 years, and even the
   worst July (2012) was 77.4% dry.
2. May is a better back-up month than June or September. Its average is similar
   (72.6% dry), but its worst year was 61.3% dry, against 53.3% for both June
   and September. It is cooler, though: an average high of 19.3 °C.
3. November to March are poor bets for outdoor events. Only 35% to 47% of days
   were dry on average, and December 2012 had just 4 dry days out of 31.

## Recommendation
Schedule flagship outdoor events in July and August, use May for overflow
events, and price covered or indoor venues for November to March.

## Limitations
Only 4 years of data from one Seattle weather record. A "dry day" means 0 mm
of precipitation, so a day with light drizzle counts as wet. The dataset's
"weather" label in the packaged copy we used does not match measured
rain after 2012, so it was not used.
Each finding gives a number, a comparison and what it means for the business. The limitations section answers BrainStation’s point that a manager wants to know what your recommendation is based on. With only four years of data, the README says “better back-up month,” not “proof.”
A README template you can copy
Every project in your data analyst portfolio needs a README like this. Dataquest’s guide lists the same core parts: the problem, the dataset and why you chose it, your process, the challenges you solved and the final insights.
# [Project title: the answer, not the tool. Example: "July is Seattle's safest month for outdoor events"]

## Business question
Who needs this answer and what decision does it support? (2 to 3 sentences)

## Data
Source (with link), time period, number of rows, licence.
What one row means.

## Tools
SQL (SQLite / PostgreSQL), Python (pandas, matplotlib), Tableau / Power BI

## Process
1. Cleaning: what you checked, what you found, what you decided and why
2. Analysis: the main queries or methods (link to the files)
3. Validation: how you checked your numbers

## Findings
1. Finding with a number and a comparison
2. Finding with a number and a comparison
3. Finding with a number and a comparison

## Recommendation
What the business should do next, in 1 to 3 sentences.

## Limitations and next steps
What the data cannot tell you, and what you would do with more time or data.

## Files
- sql/ or step2_sql.py: queries
- notebooks/ or step3_analysis.py: analysis and chart
- images/chart.png
Put the chart near the top so the answer is visible without scrolling, and name the project after the finding: “July is Seattle’s safest month for outdoor events” says far more than “Weather analysis with SQL.”
Using your portfolio to get a data analyst job with no experience
A portfolio only helps if reviewers see it and if you can talk about it.
- Link it everywhere. Put your GitHub or portfolio link at the top of your resume and on your LinkedIn profile, and link the single most relevant project in each application.
- Match projects to the job. Coursera’s guide suggests choosing projects that fit your interests, for example climate or health care data. If you apply to retail jobs, a sales analysis is more relevant than a weather one.
- Practise the two-minute walkthrough. Google’s capstone includes a module on how to “discuss your portfolio and highlight specific skills in interview scenarios.” Practise saying the question, one cleaning decision, the main finding and the recommendation in that order.
Common data analyst portfolio mistakes
- No business question. A notebook of charts with no question at the top shows you can use a tool, not that you can think like an analyst.
- Code without a write-up. If the reviewer has to read your code to find the answer, you have made their job harder than it needs to be.
- Only overused datasets. Titanic and similar beginner datasets are fine for practice, but they do not set you apart.
- Hiding the cleaning. The weather label problem above is the most interesting part of the sample project. Your own data problems are often the best evidence of skill.
- Claiming more than the data shows. Four years of data supports “July was one of the three driest months in every year we checked,” not “it never rains in July.”
Frequently asked questions
How many projects should a data analyst portfolio have?
Three or four complete projects is the common advice from sources such as Dataquest and Interview Query. Together they should show SQL, Python or spreadsheets, and a dashboard or clear charts. Finish and document each project before starting the next.
Can I get a data analyst job with no experience?
It is harder without experience, and a portfolio is how you show skills without a job title to point to. Google’s capstone course notes that hiring managers want proof you can apply concepts in a meaningful way. Projects with a business question, clean data work and written findings give them that proof.
What are good data analyst projects for beginners?
Good beginner projects answer a simple business question with public data: seasonal demand, a sales or KPI dashboard, customer churn, or local city services data. Avoid starting with the most overused datasets, and keep the first project small enough to finish and document in a week.
Do I need a personal website for my portfolio?
No. A GitHub profile with pinned repositories, a Tableau Public profile or Kaggle notebooks all work, and Coursera’s guide says the contents matter more than where you host them. A simple site can come later.
Should I include certificate projects in my portfolio?
Yes, but make them your own. Google and IBM certificate capstones are designed for portfolios, but other learners complete the same ones, so add your own question, a second dataset or a deeper analysis to stand out.
Key points
- A data analyst portfolio gets interviews when each project shows a business question, your reasoning, visible cleaning, readable SQL, clear charts and a recommendation.
- Three or four strong projects with a README each beat a long list of unfinished notebooks.
- In our sample project, the dataset’s “weather” field called 123 of 2014’s 150 wet days “fog,” so we measured dry days from precipitation instead.
- SQL window functions showed July was one of the three driest months in all four years (91.1% dry on average), and pandas confirmed the numbers.
- Lead the README with the answer, put the chart near the top and name the tools plainly so recruiters can scan it.
Sources
- Google and Coursera, Google Data Analytics Capstone: Complete a Case Study
- Google Career Certificates, Google Data Analytics Certificate
- IBM and Coursera, IBM Data Analyst Professional Certificate
- Coursera Staff, How to Build a Data Analyst Portfolio: Tips for Success
- BrainStation, Data Analyst Portfolio career guide
- Brian Graves, Analytics in Action, The 3-Project Portfolio That Actually Gets Analyst Interviews
- Anishta Purrahoo, Dataquest, Step-by-Step Guide: Building and Presenting Your Data Portfolio
- Interview Query, How to Create a Stand Out Data Analyst Portfolio
- Emily Stevens, CareerFoundry, How to Build a Data Analyst Portfolio That Will Get You Hired
- GitHub Docs, Managing your profile README
- GitHub Docs, Pinning items to your profile
- Tableau, Tableau Public
- Kaggle, Notebooks documentation
- SQLite documentation, Window Functions
- Vega, vega-datasets catalog (datapackage.md), source and licence of the Seattle weather data
- Vega, vega-datasets repository and README
- Vega, vega-datasets CHANGELOG, version 2.0 re-encoding of the Seattle weather label
- Altair, vega_datasets repository (archived; datasets moved to altair.datasets)