The Data Analyst Roadmap is an easy and structured pathway which helps to those who are completely beginners to learn about data analysis. This roadmap will move from basic data skills to job-ready expertise. In 2026, data analytics is one of the most in-demand careers and professions among data professionals, but many beginners feel confused about this from where to start and what to learn next and grow easily.
This roadmap simplifies the journey by breaking it into clear, practical steps from learning Excel and basic statistics to mastering SQL, Python, and data visualization tools whihc is clearly explained for beginners in an easy way. More importantly, it emphasises building real-world projects and a strong portfolio, which are essential for landing your first job.
If you are starting from scratch or switching careers, this guide will help you in details to focus on the right skills at the right time and avoid common beginner mistakes which mostly face all beginners at the initial stage of their learning.
Quick Answer:
A data analyst roadmap is starting from the basic concept with Excel and basic statistics for data, moves to SQL for querying data, then Python for deeper analysis, and wraps up with visualization tools like Power BI or Tableau. The final step is building real-world portfolio projects on the basis of which this give the proof that you can solve business problems but not just only run the code.
Why Choose a Career in Data Analytics in 2026?
To choose Data Analytics as a career in this advanced era, so you need clear justification which will help you that why to choose as a career not just as part time job.
What does a data analyst actually do daily?
Many people imagine and thinking that analysts are sitting in the front of dashboards all day long. But the reality is more different and more interesting than looking just from the outside.
A typical day involves the extraction of data from a database with SQL, cleaning it (which takes longer time and also a boring part but necessary for the clarification), running some analysis in Python or Excel, and then presenting the hidden facts to a team that doesn’t want to see raw numbers; they need cleaned data.
You are basically a translator between data and decisions. I have seen analysts which they save companies from thousands of dollars just by spotting one weird pattern in a spreadsheet.
Is data analytics still in demand?
Yes, and the demand is not going to slow down because nowadays all companies are going to deal their customers through in a digitalised way.
Every company collects data, which is nearly every company now needs someone to make useful meaning of it because it is collected in raw form.
Now the role of analysts has changed. They now help to shape the strategy, not just only report data. Entry-level jobs are very competitive, but there are definitely opportunities available.
What industries hire data analysts?
There are many industries which need data analysts such as Finance, healthcare, e-commerce, logistics, marketing, and SaaS are the biggest employers. Don’t ignore the government and nonprofit organisations; they also need data and data analysts.
The tools you learn can be used in all of these areas, so you won’t be limited to just one field when you start but one point to be noted that these organizations have different types of analysis which need to covering different perspectives for them.
What Skills Do You Need to Become a Data Analyst?
Data analyst skills roadmap
Here, we will discuss the Data analyst skills roadmap. This data analyst skills roadmap covers both technical and soft skills
Core skills and
Soft skills.
Core Skills: What are the core technical skills?
The core technical skills that you need for the data analyst role are:
Learn Excel
Then SQL
And then Python
Excel: Why Excel is the starting point for a data analyst?
Excel is where I would tell anyone to begin, not because it’s just the basic of data analysis level, but because it teaches you how to structured data in a very easily understandable format.
You will learn to filter, sort, clean, use VLOOKUP, build pivot tables, and think in rows and columns. These habits make SQL and Python click faster later.
A lot of professional analysts still use Excel daily, even after learning Python because it is now necessary along with Python.
Concrete example: Build a sales tracker using pivot tables and conditional formatting. It sounds simple and it is but it forces on you to think about data relationships in will form.
SQL: How SQL is important for data analysts?
SQL is important for data analysts because it is the main key to extract data from nearly every database system available. Most job descriptions give priority to this skill for a reason.
The good news is that the fundamental methods, such as SELECT, WHERE, GROUP BY, and JOIN can be mastered in just a few weeks.
I recommend dedicating at least a month to learning these basics before moving on to more advanced topics.
Python: When should you learn Python?
After learning SQL, Python becomes more useful when your dataset is too big for Excel or you need to automate repetitive tasks. In Python, you need libraries like Pandas for data manipulation and Matplotlib for data visualization are the main libraries which are necessary.
There is no need to cover and learn Python deeply; however, most analyst roles need you to be functional, not a software engineer.
Soft Skills: What are the essential soft skills?
We have discussed the essential soft skills in details which are given below:
Problem-solving skill
Communication
Why is problem-solving critical?
The tools you use are not as important as your thinking because when you deal with the data the critical thinking is necessary to solve a particular problem in an efficient manner. A dataset won’t come with the insight already marked because the data will be present in raw form.
You need to ask the right questions, create a hypothesis, and test it according to your organization’s needs. You build this skill by working with messy, real-world datasets, not with cleaned data because cleaned data no need to be solved.
How does communication impact your career?
Communication impacts your career because when You working and perform the most sophisticated analysis in the room, but if you cannot explain it to a product manager in simple and easy language, it would not influence anything.
At least daily practice some writing short, clear summaries of your findings and tasks which you have done. The data visualizations like charts with no context are useless but always lead with the “so what.”
What Is the Step-by-Step Data Analyst Roadmap?
The step-by-step data analyst roadmap is presented below in detail with full explanation:
Step-by-Step Data Analyst Roadmap
Step 1: How do you start with data fundamentals?
The main starting point is to understand basically “what is data?” actually such as structured vs unstructured, quantitative vs qualitative, and why data quality matters. At least spend a week on the basic statistics domain or knowledge like mean, median, variance, and correlation.
Step 2: How to master Excel for analysis?
To master Excel for analysis then go beyond basic formulas and learn XLOOKUP, pivot tables, and data validation. Then tackle Power Query because it is Excel’s underrated data cleaning tool. At least build two or three dashboards from scratch using the above techniques before on data. Use public datasets from Kaggle or government sources so that your projects feel real, not ready made.
Step 3: How to learn SQL effectively?
To learn SQL effectively then don’t just read about SQL but also write some queries from day one. SQLiteOnline.com lets you practice in a browser without installing anything. Work through Mode Analytics’ SQL tutorial or SQLZOO. The main goal about SQL is to join multiple tables, aggregate data, and write subqueries without looking at a reference guide every five minutes.
Actionable tip: Download a public dataset (like NYC taxi trips or Airbnb listings) and write 10 different queries on it. You will learn more in two hours than a week of watching tutorials.
Step 4: When and how should you learn Python?
There is no boundary to learn python but start to learn Python once when you feel and familiars with the SQL which need time usually around 3 to 4 months. In Python focus on Pandas for data manipulation and Matplotlib or Seaborn for visualization. But most important don’t try to learn everything. Most analysts use maybe 20% of Python’s features 80% of the time.
Step 5: How do you learn data visualization tools?
To learn data visualisation tools then the tools like Power BI and Tableau are the two dominant tools in most job postings. Both offer free versions. I would recommend starting with Power BI because it integrates with Excel and Microsoft products that most companies already use. Build dashboards with the real data and track your own spending, analyse sports stats, whatever keeps you engaged.
Step 6: How do you build real-world projects?
Projects are necessary when you are leaning some skill because Projects are the actual things where theory becomes skill. Most importantly, don’t wait until you feel “ready” because you will never if you leave. Pick a domain you care about such as health, sports, finance, and find a related dataset on Kaggle. Define a business question, clean the data, analyse it, and present the results as if you are explaining to a manager.
Step 7: How do you create a job-ready portfolio?
A GitHub profile with 3–5 solid projects beats a stack of certifications. Each project should have a README that explains the business problem, your approach, and the key insight. Include screenshots of dashboards or visualisations. Recruiters spend about 90 seconds on a portfolio; make those seconds count.
Data Analyst Tools Progression
Stage
Tools
Focus Area
Outcome
Beginner
Excel
Data basics, cleaning
Understand data structure
Intermediate
SQL
Querying, data extraction
Work with databases
Intermediate
Python
Analysis, automation
Handle complex datasets
Advanced
Power BI/Tableau
Visualization
Create dashboards
Job-Ready
GitHub + Projects
Portfolio building
Demonstrate real skills
What Projects Should You Build at Each Stage?
Data Analyst Projects
Data Analyst Projects that you should Build at each stage is categories in three stages, which are given below:
Beginner projects
Intermediate projects
Advanced projects
Beginner projects (Excel-based)
Start with a personal finance tracker or a sales performance dashboard. Use a public e-commerce dataset and build a pivot table analysis showing which product categories perform best by month. The goal is to get comfortable with data manipulation, not to impress anyone yet.
Intermediate projects (SQL + dashboards)
Move to a multi-table database. A great project: take a public HR dataset, write SQL queries to find attrition patterns, then visualize the results in Power BI. This mirrors what real analysts do in HR or people analytics roles. It also makes for a great interview talking point.
Advanced projects (Python + end-to-end analysis)
Build an end-to-end project that goes from raw CSV to insight. For example: scrape or download customer churn data, clean it with Pandas, run a correlation analysis, and present findings in a Jupyter Notebook with clear commentary. If you can walk someone through your thought process, your job-ready.
What Is the “Data Analyst Growth Matrix” Framework?
The “Data Analyst Growth Matrix” Framework is clarified below:
How does the Growth Matrix accelerate your career?
I have create this framework after observation that many individuals either hurry through tools without truly applying them or use skills without understanding their current stage. The Growth Matrix provides you with a mental map, ensuring that you always know where you stand and what to focus on next. It’s a five-stage loop rather than a one-time path.
Stage 1: Foundation (Learn)
Excel, basic statistics, and data literacy. You are building the main vocabulary here for your career. Don’t skip this weak foundations show up in interviews.
Stage 2: Technical Skills (Build)
SQL, Python basics, and data cleaning techniques. This is where most people spend 60% of their total learning time n these.
Stage 3: Application (Apply)
Real-world projects and dashboards. Stop following tutorials and start setting your own questions. This stage transforms you from a learner into a practitioner.
Stage 4: Professional (Perform)
Portfolio development, mock interviews, and resume optimization. Treat your job search like a project, track applications, measure your response rate, iterate.
Stage 5: Specialisation (Scale)
Domain expertise in finance, marketing, product analytics, or another vertical. This is what turns a good analyst into an indispensable one.
What Do Real Data Analyst Career Journeys Look Like?
Example 1: From Excel Beginner to Business Analyst
One person I know started by managing sales reports in Excel at a retail company. She automated her own reports with Power Query, built dashboards that the sales team actually used, and got noticed internally. Within 18 months, she transitioned into a business analyst role, no coding bootcamp required.
Example 2: From Non-Tech Background to Data Analyst
A history graduate spent six months learning in SQL and Python on evenings and weekends. He built three portfolio projects in which one on election data, one on book sales trends, and one on COVID hospitalization rates. He landed his first entry-level analyst role because his projects told a story about his curiosity, not just his technical skills.
Example 3: From Data Analyst to Data Scientist
An analyst who spent two years doing reporting and dashboarding started adding machine learning to her toolkit. She took a Coursera specialization, applied models to her company’s customer data as side projects, and eventually moved into a data science role. The analyst foundation made the transition far smoother than coming from a pure software background.
How Do You Become Job-Ready as a Data Analyst?
What should a strong portfolio include?
A strong portfolio include three to five projects, each solving a different type of problem. At least one should include SQL, one Python, and one dashboard visualization. Include with a short-written summary for each project, not just code only. Hiring managers often are not technical, and a good narrative makes your work accessible.
How do you prepare for data analyst interviews?
To prepare for data analyst interviews you should practice SQL query writing under time pressure using sites like LeetCode and StratasScratch have analyst-specific problems. Prepare a few lines specially “tell me about a project” stories using the STAR format. Expect behavioural questions alongside technical ones. Companies want to know if you can communicate, not just query.
What common mistakes beginners should avoid?
The common mistakes beginners should avoid is the biggest one: tool-hopping. People jump from Excel to SQL to Python to R to Spark without getting solid at any of them. Pick the stack, go deep, and build projects. Another common mistake is treating certifications as a substitute for a portfolio. They are not, they help, but they’re not the main event.
What Tools and Technologies Should You Learn?
Tools and Technologies Should You Learn are divided in compulsory mean must have and in optional:
Which tools are must-haves vs optional?
Must-have: Excel, SQL (any flavour such as PostgreSQL is a good start), Python (Pandas + Matplotlib), and either Power BI or Tableau. These appear in the overwhelming majority of job descriptions.
Useful but optional: R, Spark, dbt, Google Looker, or Snowflake. These become relevant once you are targeting senior or specialized roles.
How do tools evolve as you progress?
In Early stages you are working with small, local datasets. Over time, you move to cloud databases and larger data pipelines. SQL stays relevant throughout it is one of those skills that scales with you. Python grows from basic scripts to full analysis workflows. The tool stack expands, but the thinking behind it stays the same.
What Is the Career Path After Becoming a Data Analyst?
There are some career paths after becoming a Data Analyst you can easily move to them:
What roles can you transition into?
Data Scientist vs Data Analyst
Data scientists typically build predictive models and work with the machine learning while Data Analysts focus on descriptive and diagnostic work like “what happened and why”. Scientists need deeper knowledge about statistics and programming, while analysts need stronger business communication. It’s not a hierarchy they’re different jobs.
Business Analyst vs Data Analyst
Business analysts focus on process improvement and requirements gathering while Data analysts are more quantitative, working directly with data. There is overlap, but data analysts tend to spend more time in SQL and Python while business analysts spend more time in Excel and PowerPoint.
Analytics Engineer vs Data Analyst
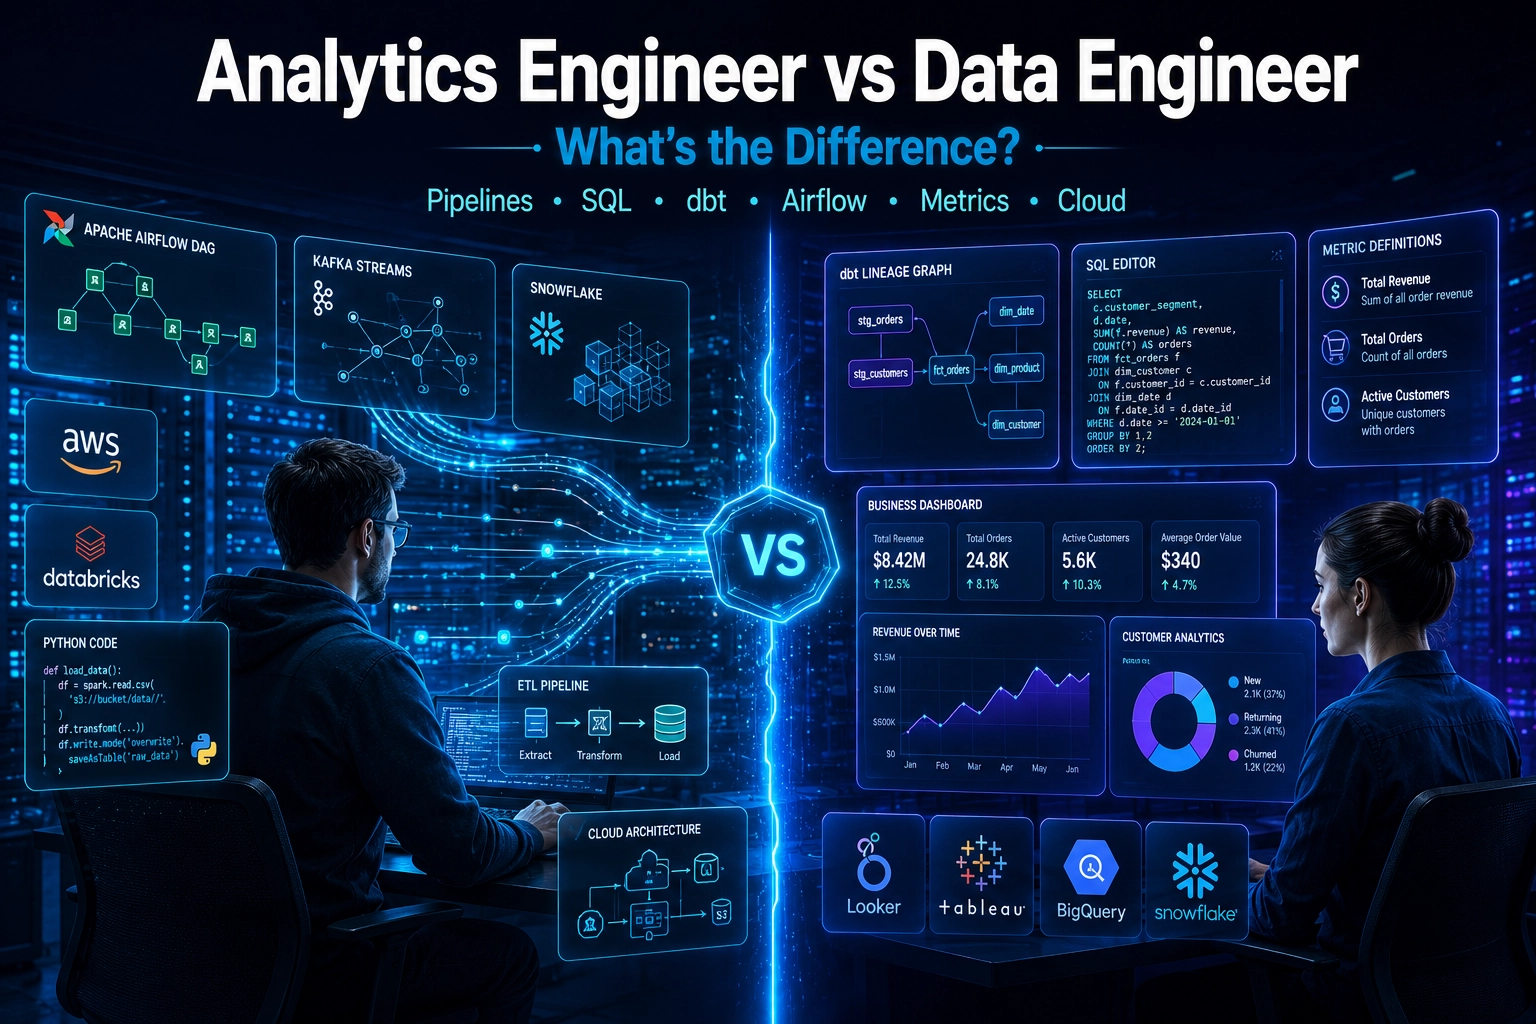
Analytics engineers build and maintain the data pipelines which is used data analysts. They work heavily with tools like dbt and data warehouses. If you enjoy the technical infrastructure side more than the analysis itself, this is a strong direction to explore.
How Long Does It Take to Become a Data Analyst?
To become a Data Analyst, it completely depends on your mind nature and leaning process but here is the guideline line as for formality:
Can you learn in 3–6 months?
Yes, if you are studying consistently and building projects alongside learning. Three months is realistic if you are putting in 2–3 hours daily. Six months is more common and leads to a stronger portfolio. It is not a race but a solid portfolio after 6 months beats a rushed one after 3.
What affects your learning speed?
Prior experience matters a lot. If you have worked with the data in any form, even Excel reporting, you will pick things up faster. Consistency beats intensity every time. Studying 90 minutes a day for six months outperforms two-week “intensive” sprints followed by two weeks off.
Frequently Asked Questions About the Data Analyst Roadmap
1) What is the best roadmap to become a data analyst?
The best roadmap to become a data analyst is to follow this path: Excel → SQL → Python → Visualization → Projects → Portfolio → Job applications. Follow it in order. Don’t skip any steps.
2) Can I become a data analyst without a degree?
Yes. You can become a data analyst without a degree because Many analysts enter the field through self-learning, certifications, and strong portfolios. What you have built matters more than what piece of paper you hold.
3) How long does it take to become job-ready?
Typically, 3–9 months depending on consistency, practice, and how much time you invest in the real-world projects.
4) Is Python mandatory for data analysts?
Not always, but it significantly improves your ability to handle large datasets and automate repetitive work. Start without it if SQL already feels like a stretch, then layer it in.
5) What projects should a beginner data analyst build?
Start with Excel dashboards, move to SQL-based data analysis on a relational database, and finish with a Python-powered end-to-end project that tackles a real business question.
🎯 Next Step: Don’t spend another day planning the roadmap, just start doing it. Download a free dataset from Kaggle, open Excel, and ask one business question. The answer does not matter as much as the habit of asking. That’s where every good analyst starts.